Balance
Daily Life Ledger
A voice-first reflection tool that helps you see what you actually accomplished each day—not just work tasks, but how you took care of yourself and your life.
- Voice-First Logging - Ramble freely about your day and let AI categorize everything into Work, Life, and Self domains.
- Four Views - Day view (3 columns), Timeline (chronological), Chat (ask questions), and Trends (graphs and patterns).
- Smart Insights - Ask conversational questions like 'Am I neglecting self-care?' or 'What did I do with Chris recently?'
Screenshots
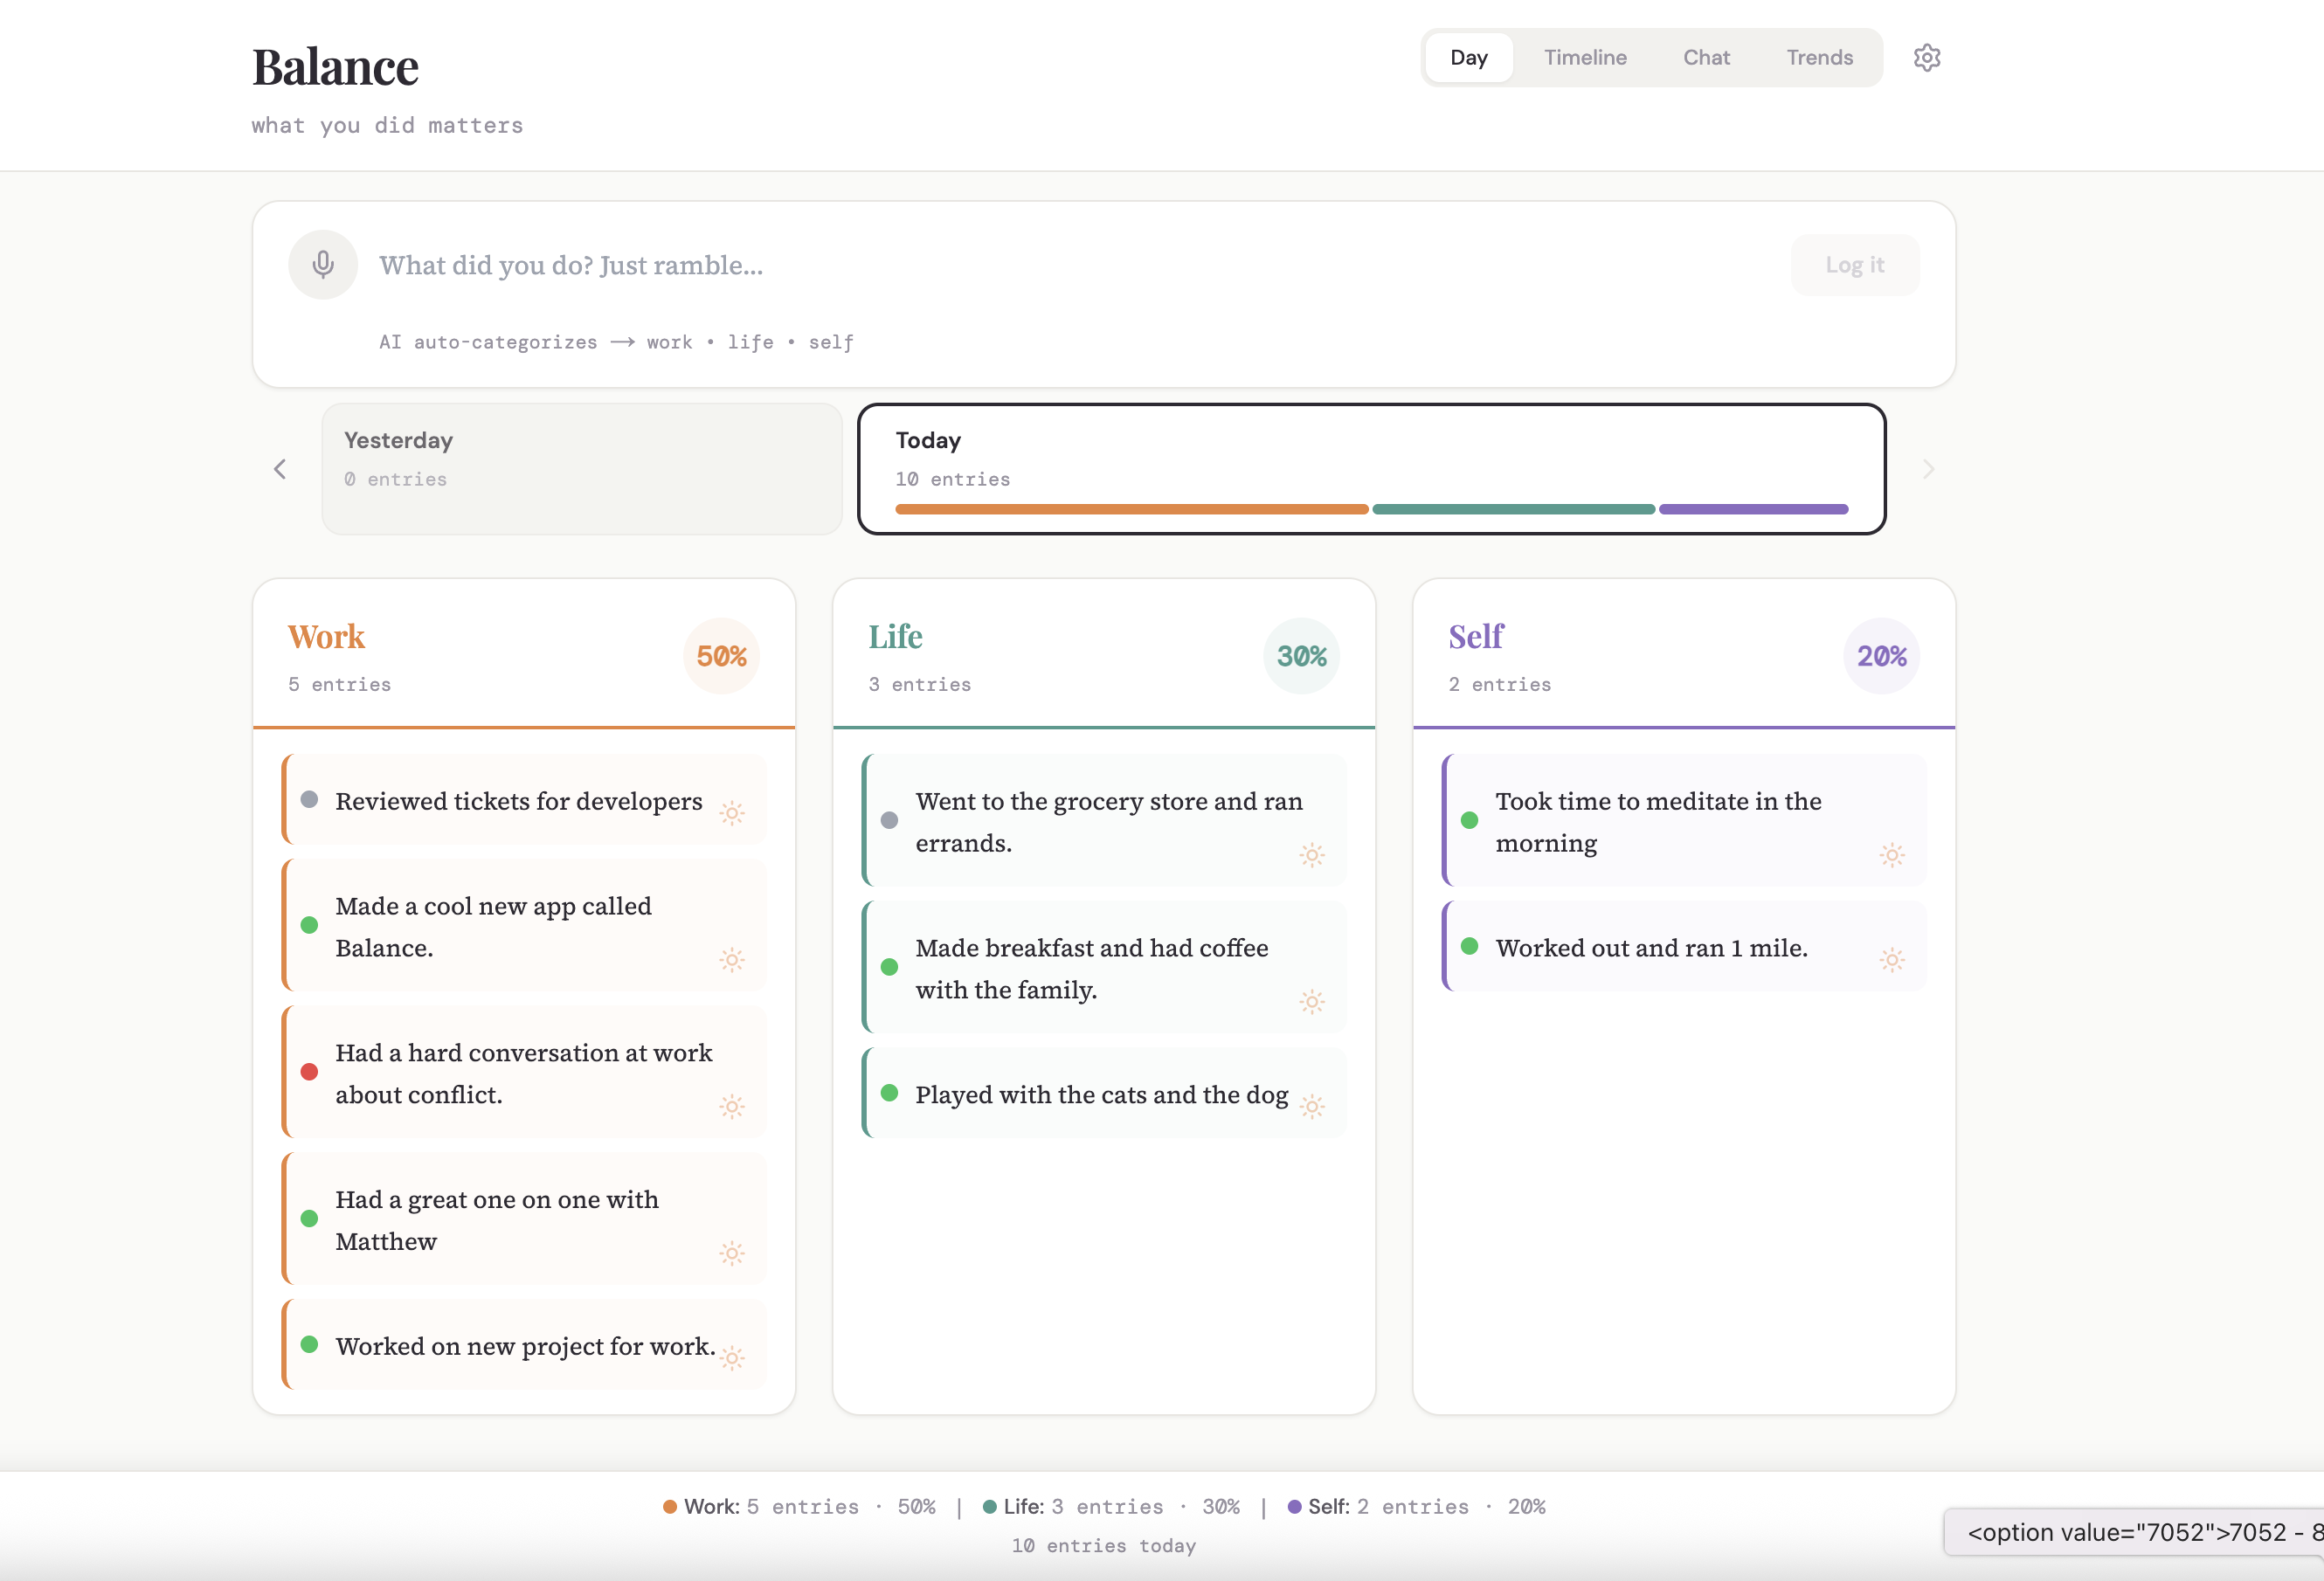
Day View - Three Domain Balance
Core Interface
The Day view organizes your activities into three columns: Work, Life, and Self. Each entry shows what you did, when, and includes visual balance bars at the top showing how your day was distributed across all three domains. This view helps you see at a glance whether you're neglecting any area of your life.
Skills
Three-Column Layout
Visual Balance Indicators
Time-Stamped Entries
Domain Categorization
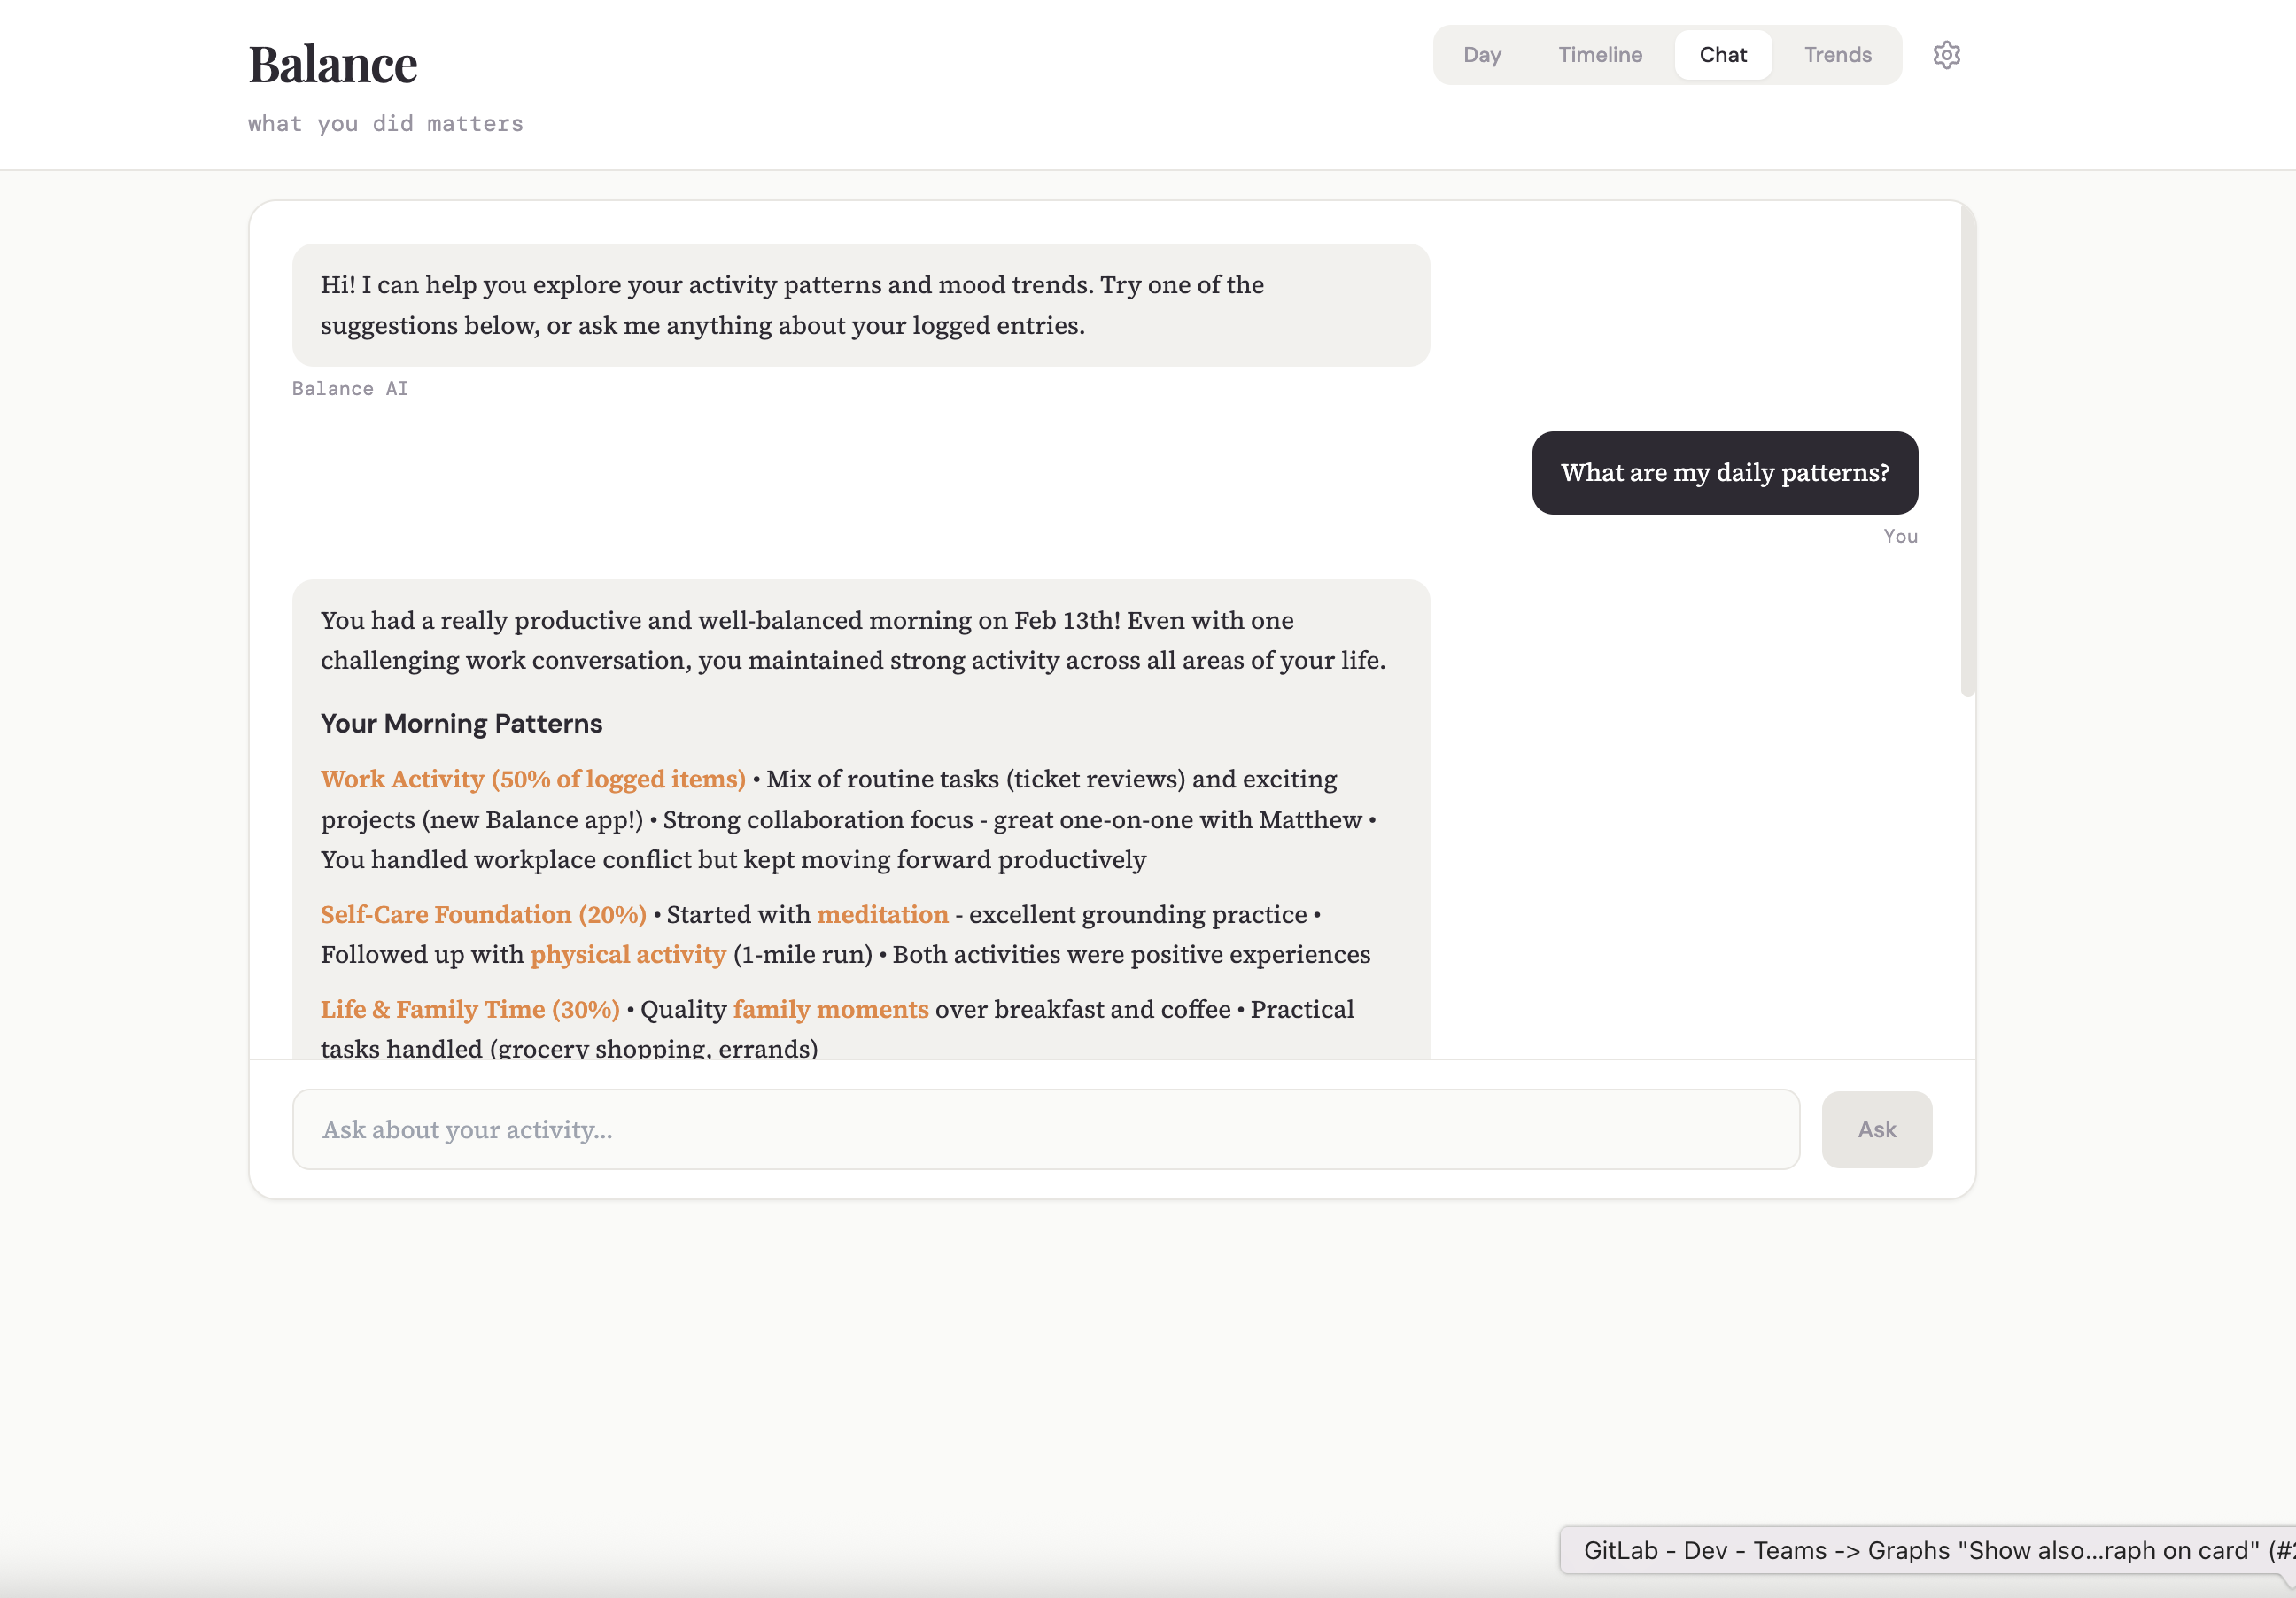
Chat View - Conversational Insights
AI Interaction
Ask Balance questions about your patterns and habits in natural language. "Am I spending enough time on self-care this week?" or "What have I done with Sarah recently?" The AI analyzes your logged activities and provides thoughtful insights, helping you understand trends and make intentional choices about how you spend your time.
Skills
Natural Language Queries
Pattern Analysis
Contextual Insights
Anthropic Claude API
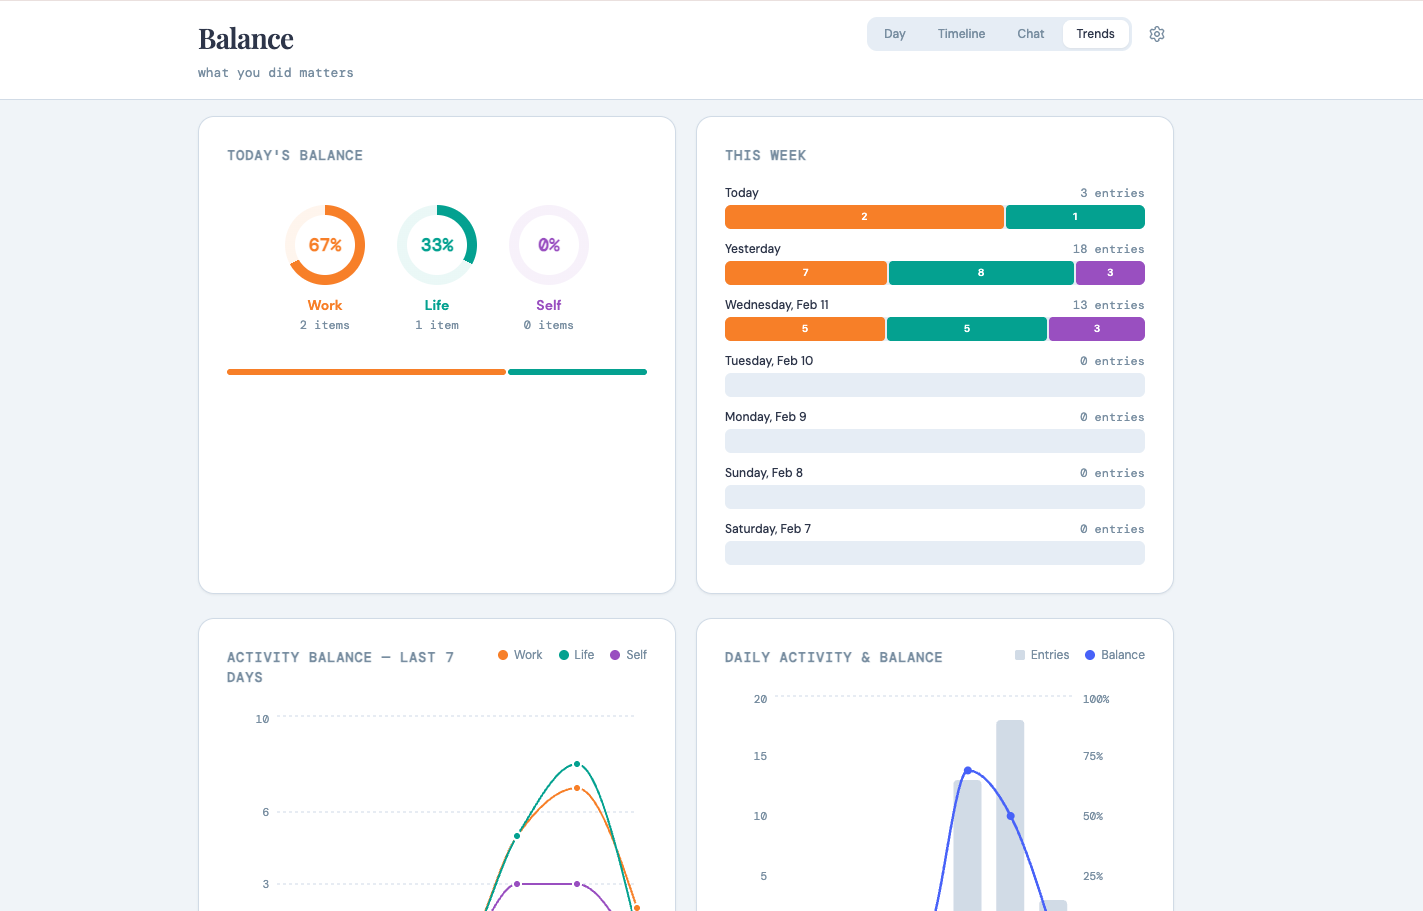
Trends View - Visual Analytics
Data Visualization
Track your Work-Life-Self balance over time with interactive charts and graphs. The Trends view reveals patterns in how you allocate your time, showing weekly and monthly distributions across all three life domains. Identify periods of imbalance and see how your priorities shift over time with beautiful, therapeutic visualizations built using Recharts.
Skills
Time-Series Graphs
Domain Distribution Charts
Pattern Recognition
Recharts Visualization